Advertising Technology and Simulation
I Built a Tiny San Francisco So Fake Commuters Could Roast My Billboard
Inside Orangeboard's 3D billboard simulator: 559 SF signs, traffic agents, saliency, OWL-ViT, vision models, heuristic scores, and honest limits.
Summarize this article
Open a prefilled request in your preferred assistant.
TL;DR
- Orangeboard, now presented as Peel, went from its first Git commit to its deployment commit in 19 hours, 51 minutes, and 49 seconds during the 24-hour YC AI Growth Hackathon; it won first place against 59 other submissions.
- The current repository contains 559 San Francisco billboard records, 52,377 OpenStreetMap road segments, 462 enriched billboard records, 1,385 board-to-business associations, a 3D Mapbox and deck.gl city, a traffic simulation, an attention lab, campaign generation, PDF export, and outbound automation.
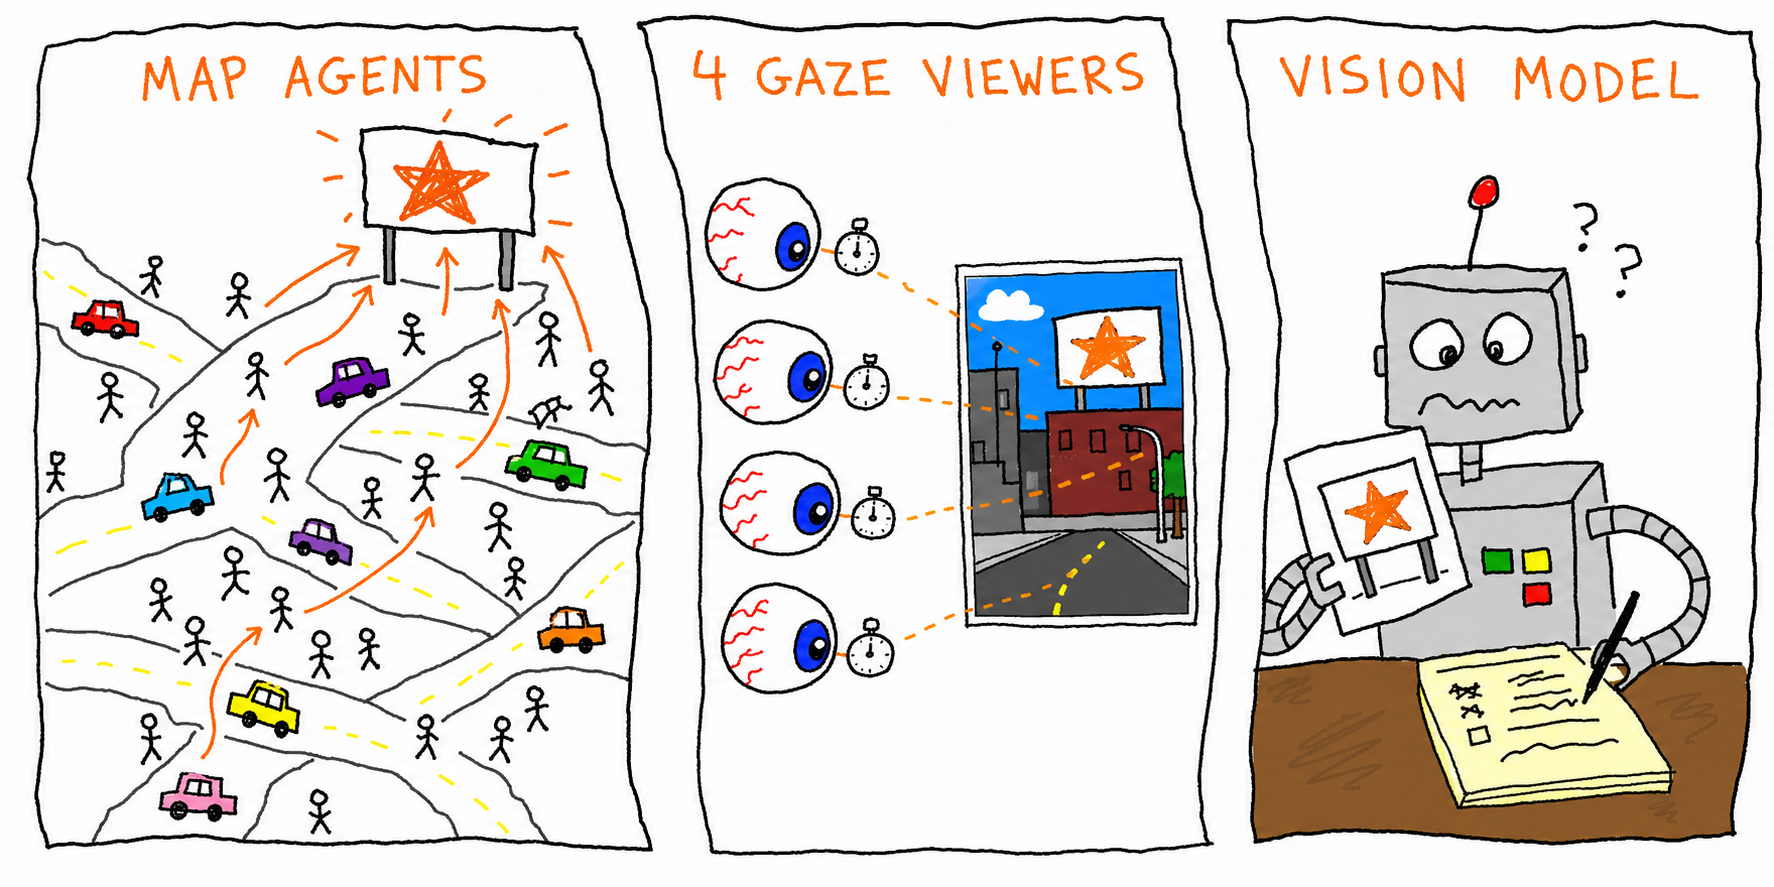
- There are three different fake observers because they solve three different problems: map agents model movement through streets, four dwell-limited gaze viewers test whether predicted fixations overlap the board, and a vision model judges semantics such as recall and legibility.
- One particularly useful trick re-ranks OWL-ViT billboard detections as
confidence * (0.15 + 0.85 * saliencyContent); a confident box over empty sky gets kneecapped without letting saliency invent a box the detector never proposed. - The honest limit matters more than the graphics. Permit coordinates and road geometry are grounded; individual paths, viewer dwell budgets, gaze, recall, and ICP-fit scores are modeled. The current opportunity API's
visibilityScoreanddwellSecondsare heuristic functions of campaign fit and nearby matches, not results from real eye tracking or the Vision Studio pipeline. - The public repository, reproducible audit, machine-readable results, live captures, and offline verifier are included; no API key or Mapbox token is stored in the article package.
The project started with a window and ended with tissues
The NUS Computing profile about me opens with a nosebleed during my final presentation at Y Combinator's San Francisco office. I was one sentence into the pitch; by the time the judges announced that Orangeboard had won, I was mostly trying to locate tissues and remain technically vertical.
The article also gets the origin right. The hackathon theme was AI growth and marketing, which made social media software the obvious move; I did not want to build the 4,000th dashboard that turns one LinkedIn post into seventeen worse LinkedIn posts, so I looked out of the window instead.
There were billboards everywhere. Physical advertising is expensive, visually dominant, and surprisingly difficult to evaluate before somebody signs a contract; a seller may have permit records and a media kit, while a buyer gets audience language broad enough to include every mammal with a commute.
The project became Orangeboard, then the live interface became Peel. Its premise is simple enough to survive the name change:
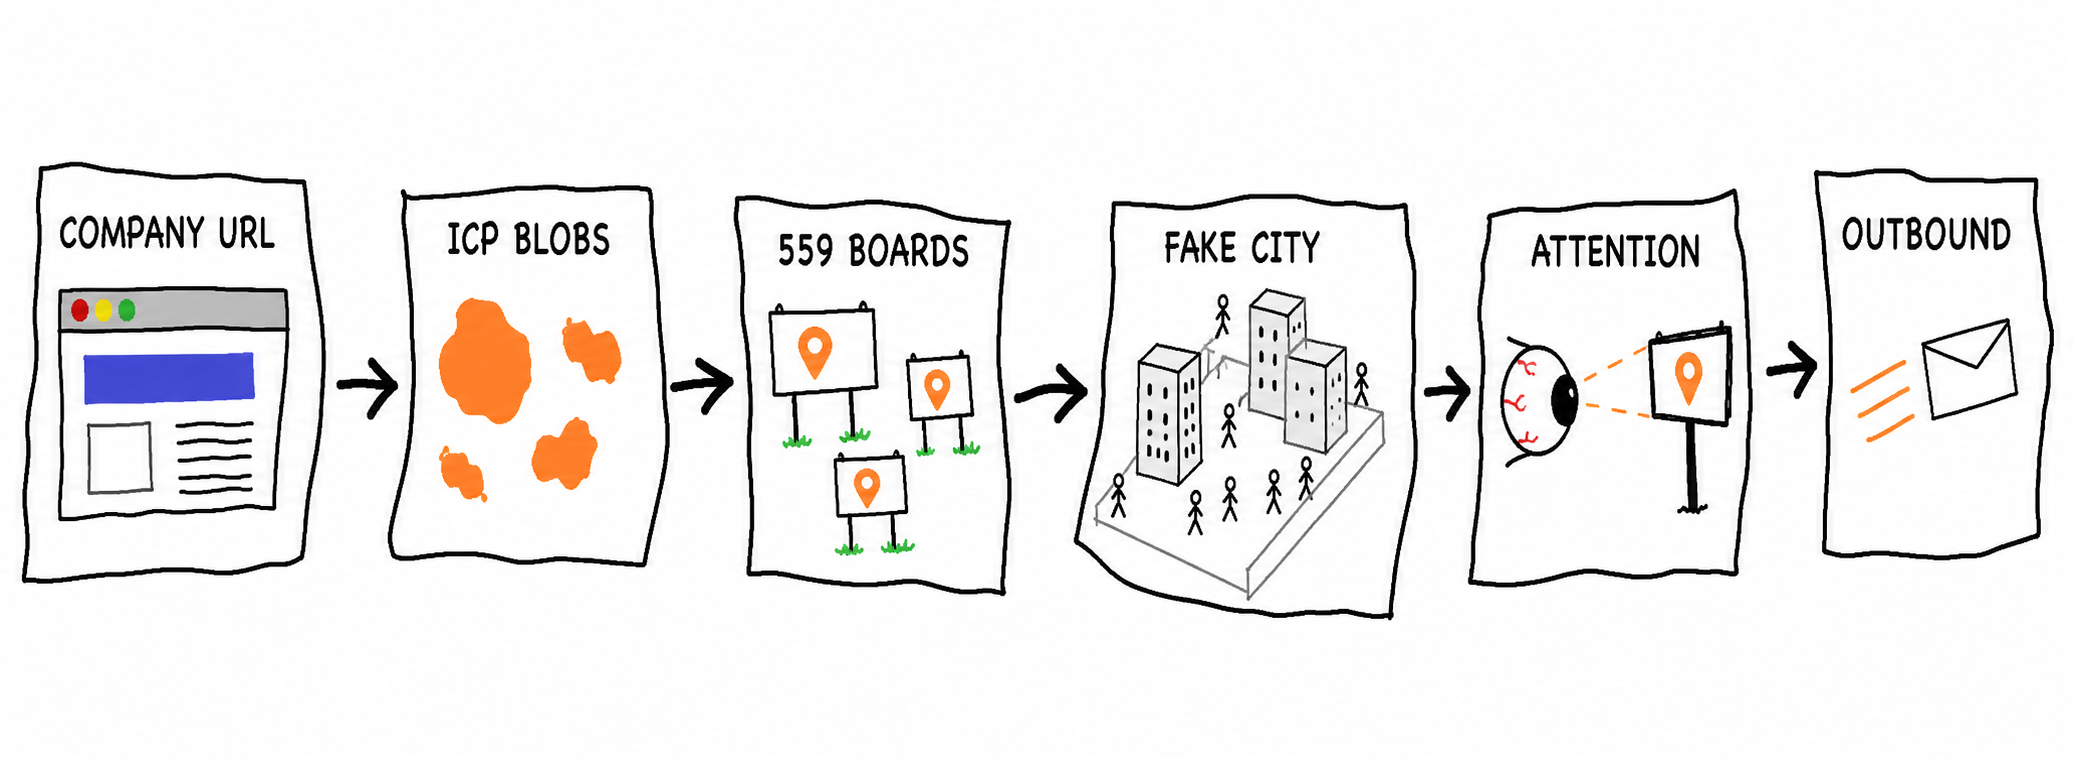
Find where a company's likely buyers cluster, locate real billboard inventory nearby, generate creative for the placement, test whether the scene can attract attention, and turn the result into an outbound campaign.
The public profile says the 24-hour build beat 59 other submissions, which means there were 60 in the field. That is useful context, but “hackathon winner” is not a technical explanation; the interesting question is how much of the system was grounded, how much was modeled, and how much was a convincing orange rectangle trying its absolute best.

capture-orangeboard.mjs at audited commit dd29e3.The product is not the 3D map
The map is the part people remember because it contains buildings, traffic, glowing opportunity zones, tiny pedestrians, billboard meshes, weather, camera movement, and enough deck.gl layers to make a laptop reconsider its priorities. The product loop is less glamorous and more valuable:
- A company URL becomes a structured creative brief and ideal-customer profile.
- Nearby businesses are matched against that profile and clustered into geographic opportunity blobs.
- Real permitted billboard records inside those areas become candidate placements.
- A creative is generated for the company and projected onto a board.
- The scene is tested for visibility, saliency, recall, and legibility.
- The selected placement becomes a report and an outbound queue for likely advertisers or accounts.
That last step is why I call the map a proof artifact rather than the product. A gorgeous simulation with no action attached becomes a screensaver; a seller needs a ranked account, a defensible reason, a board-specific mockup, and a way to start the conversation.
Orangeboard connects those pieces through Orange Slice and Fiber AI when the relevant keys are configured. Without them, it shows a staged preview instead of throwing a server error; this matters because a hackathon demo should not collapse into an empty rectangle because one enrichment provider is having feelings.
What actually happened in 19 hours and 52 minutes
The repository gives a bounded timeline. The first commit was authored at 6:40:35 p.m. Pacific on June 27, 2026; the commit named feat: finalize orangeboard deployment arrived at 2:32:24 p.m. on June 28. The elapsed time is exactly 71,509 seconds, or 19.86 hours.
That does not prove every thought, design sketch, or external action happened inside the Git window. It proves the interval between those two immutable repository events, so that is the claim I use.
The early history is delightfully direct:
| Pacific time | Commit | What changed |
|---|---|---|
| Jun 27, 6:40 p.m. | 955164b | Initial project commit |
| Jun 27, 8:24 p.m. | a8b9fdd | Orangeboard prototype initialized |
| Jun 27, 11:26 p.m. | f8a373f | Depth-correct map, interleaved deck.gl, crowd simulation, and Vision Studio |
| Jun 28, 2:32 p.m. | 68ee8ba | Deployment finalized |
The third commit is the important one. It turns the build from a form with a map into a spatial system: Mapbox owns the camera and basemap, deck.gl renders interleaved layers that can sit behind or in front of 3D buildings correctly, billboard meshes occupy geographic coordinates, and simulated agents move through the scene.
This was not 20 hours of elegant architecture. The original Map.tsx eventually reached roughly 3,900 lines; later commits extracted traffic, geometry, reports, onboarding, and other pure logic into separate modules. Hackathon code is a loan against future comprehension, and the interest begins accruing immediately after the judges leave.
The current audited checkout has 103 TypeScript or TSX files under app/, 21,557 lines across those files, and 17 API routes. Those counts do not prove quality or productivity; they prove that the winning visual is attached to a non-trivial amount of application surface.
Ground the city before inventing people
The project gets its most important decision right: fake behavior should move over real geometry.
The checked-in datasets contain:
| Dataset | Audited count | What it contributes |
|---|---|---|
| SF Planning billboard records | 559 | Coordinates, permit metadata, addresses, lifecycle fields, and portal links |
| OpenStreetMap road segments | 52,377 | Paths agents can follow |
| Vehicle road segments | 13,090 | Trunk, primary, secondary, tertiary, and residential roads |
| Pedestrian road segments | 39,287 | Footways, pedestrian ways, and paths |
| Pedestrian hotspot weights | 20 | Checked-in fallback spawn weights by location and hour |
| Enriched billboard records | 462 | Boards associated with nearby company context |
| Board-to-business associations | 1,385 | Nearby-business evidence used for ICP matching |
| Unique business names | 782 | Deduplicated names across those associations |
The 559 boards came from San Francisco Planning's General Advertising Sign Program map. The repository's scraper pages through the underlying ArcGIS layer, converts coordinates into GeoJSON, preserves permit fields, and writes both map-ready and spreadsheet-ready outputs.
A GASP record proves that a permitted sign record exists at a coordinate; it does not prove that the board is currently available, that the listed owner will sell it, that a dimension field is accurate, or that the price somebody typed into a deck last quarter remains valid. Orangeboard's UI falls back to phrases such as “seller-confirmed” and “field verification required” for exactly this reason.
The street network comes from OpenStreetMap through Overpass. Agents therefore follow actual line geometry, but they do not inherit the behavior of actual commuters; Orangeboard knows where a footway is and then invents who walks down it.
The pedestrian weights deserve an extra asterisk. The prefetch script tries three DataSF dataset IDs; if none produces usable rows, it writes 20 hand-calibrated San Francisco hotspots multiplied by a 24-hour demand curve. The audited sf-ped-counts.json contains those 20 entries, so the current article calls them fallback weights rather than SFMTA measurements.
This is the pattern I want throughout the product: use real data where it exists, model the missing behavior, and attach the provenance before the pixels become persuasive enough to erase it.
The tiny city's population is mostly fictional
The live map currently renders a baseline of 150 pedestrians and 80 cars. Agent counts then scale by hour; pedestrians follow the hourly demand multiplier directly, while car counts retain a 40% floor plus a 60% time-varying component.
The public NUS profile summarizes the project as simulating thousands of pedestrians. The audited checkout does not render thousands simultaneously; it renders a time-scaled baseline of 150. A longer session can produce thousands of simulated observations and sightline events, but the repository evidence does not support saying that thousands of bodies occupy one frame, so I do not say it here.
The motion model is straightforward:
spawn on a nearby road segment
  -> interpolate along its coordinates
  -> inspect connected segments at the endpoint
  -> choose a connected segment randomly
  -> reverse at a dead end
Vehicle speed varies by road class, from 1.4x on trunk roads to 0.65x on residential streets; pedestrian footways use 1.0x, while ordinary paths use 0.8x. The absolute simulation speed is deliberately boosted for visibility at city zoom levels, so a dot does not spend the entire demo advancing half a pixel while the judge checks email.
Buses have a stronger real-time path. The server route can proxy live SF Muni vehicle positions and cache them for 30 seconds; if that feed is unavailable, the UI falls back to 16 synthetic buses moving along eight hard-coded route shapes. The live capture used that fallback and labeled it synthetic, which is exactly what a trustworthy demo should do.
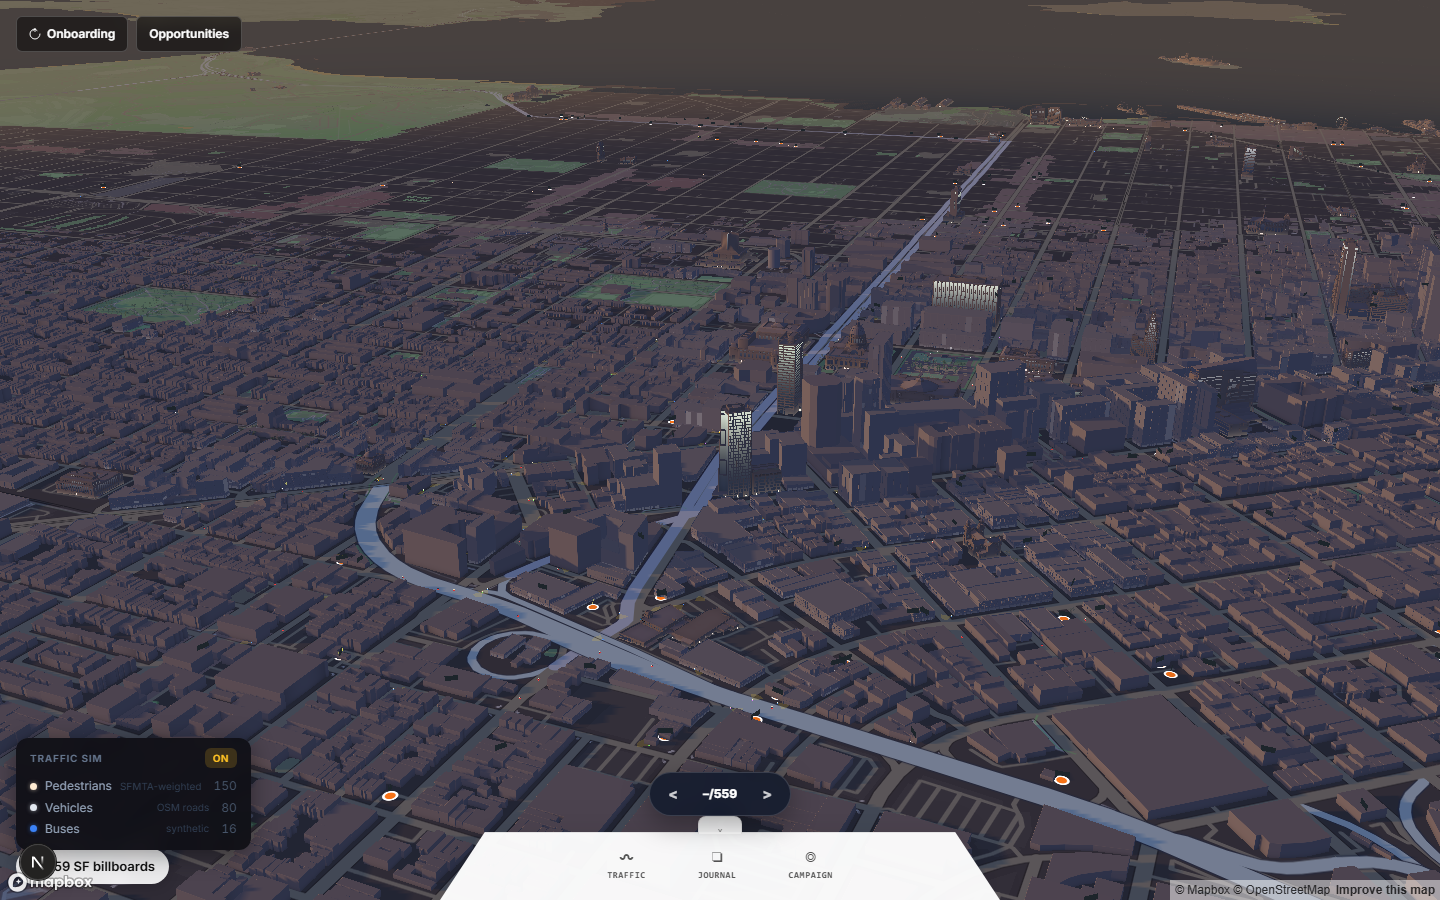
/map?campaign=1 route at 1440 by 900. Subtext: San Francisco has been rebuilt inside Chrome and the buses are unionizing against requestAnimationFrame. Source: First-party capture; the browser reported no page errors or blocking network failures.Map agents support questions about spatial flow and whether a pedestrian reaches a sightline; they do not tell Orangeboard what the pedestrian notices, understands, or remembers. That requires two more kinds of fake observer.
Why Orangeboard needs three kinds of fake observer
1. Map agents answer where
The 150 pedestrians and 80 cars occupy geographic coordinates, follow road geometry, and can trigger camera or sightline events near a board. They are useful for spatial animation and repeated scene sampling; they do not contain a visual cortex, despite the excellent posture of the deck.gl columns.
2. Gaze viewers answer whether the eye reaches the board
Vision Studio first computes a bottom-up saliency map from the actual image pixels. The implementation follows the broad logic of the Itti, Koch, and Niebur saliency model: intensity, color-opponent, and orientation contrast contribute conspicuity signals; a winner-take-all scanpath selects fixations, while inhibition of return discourages the model from staring at the same location forever.
The project then creates four synthetic viewers with explicit dwell budgets:
| Viewer | Dwell budget | Fixations at 230 ms each |
|---|---|---|
| Phone-glance scroller | 0.6 s | 2 |
| Rushing driver | 1.1 s | 4 |
| Passenger or rider | 2.2 s | 9 |
| Sidewalk pedestrian | 4.2 s | 18 |
For each viewer, Orangeboard takes only the fixations that fit inside the dwell budget; it then asks whether any fixation lands inside the detected billboard region plus a fixed 2.5% foveal margin. The first matching fixation becomes timeToNotice for that viewer.
The honesty property is more interesting than the formula: the saliency scanpath is computed without being told where the billboard is. The detector produces a region and the saliency model produces predicted gaze; the score is their overlap. If the billboard box were used to generate the heatmap, every campaign would receive the visual equivalent of a participation trophy.
3. The vision model answers what the viewer understands
Pixel saliency can predict contrast and fixation; it cannot reliably say whether a person remembers a brand, reads the CTA, understands the message, or wants to screenshot the joke. A vision-language model handles that semantic layer and returns structured judgments for recall, legibility, shareability, emotion, and critique.
The final result fuses these systems, but they should remain conceptually separate:
map agents      = where an observation can happen
saliency viewers = whether predicted gaze reaches the board in time
vision model     = what the image appears to communicate
Calling all three “AI pedestrians” would sound simpler and explain almost nothing.
The billboard detector once became interested in empty sky
The attention score depends on locating the billboard. A perfect saliency model cannot rescue a region box placed over a cloud; it will correctly report that nobody looked at the empty sky, then Orangeboard will incorrectly conclude that the billboard is invisible.
The browser can use the quantized Xenova/owlvit-base-patch32 model, based on OWL-ViT, for zero-shot object detection. It prompts for terms such as “a billboard” and “a large outdoor ad,” keeps up to 12 candidate regions, filters absurdly small or huge boxes, and originally selected the highest model confidence.
That failed on a Street View image because the model confidently selected a patch of sky beside a utility pole. The fix reuses the saliency map already in memory:
content = meanSaliencyInside(candidate.box)
rank = candidate.confidence * (0.15 + 0.85 * content)
A candidate over blank sky has content near zero, so it retains only 15% of its confidence; a textured, visually active billboard keeps most of its score. The 15% floor is important because saliency is allowed to demote detector candidates, not veto object detection entirely.
This is a compact example of hybrid modeling done well. The detector answers “which region resembles a billboard,” while saliency answers “which region contains visual content an eye might inspect”; neither signal is asked to impersonate the other.
There are still failure modes. If OWL-ViT never proposes a region near the real board, re-ranking cannot manufacture one; Orangeboard can fall back to a server-side Grounding DINO box, a rough vision-model box, or a manual region dragged by the user. Manual drag receives the highest source rank because sometimes the best model is a human being with a cursor and very little patience.
The score I refuse to call a measurement
The interface contains several numbers that look empirical. Some come from the attention pipeline; some do not.
The current opportunity route builds a board recommendation with this logic, simplified from the source:
fitScore = clamp(opportunityScore - rankPenalty + nearbyMatches, 62, 99)
visibilityScore = clamp(fitScore - 4 + min(6, nearbyMatches), 55, 96)
dwellSeconds = clamp(round(10 + visibilityScore / 7 + nearbyMatches), 9, 28)
That visibilityScore is a heuristic presentation value derived from campaign fit and nearby-business matches. It is not the output of fuseStreet, it is not a measurement from an eye tracker, and it is not a physical line-of-sight calculation; dwellSeconds is another derived estimate built on top of it.
This is the most important technical limitation in the current system because the UI can make those numbers look like physics. The next architecture step should replace or relabel them:
- Rename the current values to
placementFitProxyandestimatedContextDwell, preserving their role in ranking. - Store Vision Studio outputs separately as
sceneAttentionEstimate, including the source image, billboard region, detector source, saliency version, viewer assumptions, and model version. - Add geometry-derived fields for apparent board area, approach angle, occlusion, distance, and visible duration along sampled paths.
- Never collapse these into one score unless the weighting is published and calibrated against real observations.
Here is the claim boundary I would put directly in the product:
| Signal | Current status | Defensible wording |
|---|---|---|
| Billboard coordinate and permit record | Grounded data | “This SF Planning record exists at this coordinate.” |
| Road and footway geometry | Grounded data | “Agents follow checked-in OpenStreetMap geometry.” |
| Live Muni vehicle coordinate | Grounded when feed is live | “This vehicle position came from the current feed.” |
| Synthetic bus fallback | Modeled and labeled | “Sixteen simulated buses are shown because the live feed is unavailable.” |
| Pedestrian or car path | Probabilistic model | “This is one possible route through the network.” |
| Saliency scanpath | Model output | “The pixel model predicts these fixation locations.” |
| Four-viewer time to notice | Model output under assumptions | “These dwell-limited synthetic viewers noticed the region under the stated fixation model.” |
| VLM recall or legibility | Model judgment | “The configured vision model returned this structured assessment.” |
Opportunity visibilityScore | Heuristic proxy | “This score currently reflects fit and nearby matches, not measured visibility.” |
| Impressions, lift, conversions, ROAS | Not established | Do not claim them. |
The simulation remains useful after making these downgrades. It becomes decision support with inspectable assumptions instead of an oracle with an orange user interface.
Graceful degradation is part of the demo
Orangeboard has several external dependencies: Mapbox, OpenAI, Google Street View, NVIDIA's detector endpoint, Muni feeds, Orange Slice, Fiber AI, and public data services. A 24-hour demo that treats every dependency as mandatory is a coordinated-distributed-systems failure wearing nice CSS.
The current application degrades by layer:
- Mapbox is required for the map routes, so the app makes that dependency explicit.
- Without OpenAI, the company brief and perception layers return deterministic heuristics.
- Without live image generation, creative generation returns a brand-aware SVG.
- Without NVIDIA, billboard detection can use browser-side OWL-ViT, a VLM region, or manual drag.
- Without usable pedestrian data, the app uses the 20 checked-in hotspot weights.
- Without live Muni vehicles, it renders and labels 16 synthetic buses.
- Without Orange Slice and Fiber keys, the outbound workflow reports
configured: falseand shows a staged path instead of pretending that prospects were contacted.
The live audit used only the Mapbox token already present in Orangeboard's ignored local environment. The landing page and map rendered at 1440 by 900, the UI reported 559 SF billboards, and the capture recorded no page errors or blocking network failures; the map correctly labeled its buses as synthetic.
A fallback should preserve the interaction while reducing the claim. Orangeboard mostly follows that rule, which is why it can remain demoable without silently inventing a successful API response.
The architecture after the hackathon smoke cleared
The current system uses Next.js 15, React 19, strict TypeScript, Mapbox GL, deck.gl, three.js, Transformers.js, Playwright, OpenAI APIs, public SF and OpenStreetMap data, Orange Slice, and Fiber AI.
The useful boundaries are clearer than the dependency list:
app/lib/trafficSim.ts        road networks, spawning, stepping, time scaling
app/lib/saliency.ts          pixel saliency, sky suppression, scanpath
app/lib/owlDetector.ts       browser OWL-ViT and saliency re-ranking
app/lib/attention.ts         dwell viewers, gaze overlap, score fusion
app/api/opportunities        ICP matching, clustering, heuristic board ranking
app/api/muni-vehicles        live transit proxy and empty-response boundary
app/components/Map.tsx       renderer and product-flow orchestration
Mapbox and deck.gl run interleaved, so custom geometry can participate in the map's depth buffer; a billboard can disappear behind a building instead of floating over it like a PowerPoint sticker. three.js handles the actual billboard mesh, while deck.gl handles large geographic layer sets and repeated agents.
The application also contains a server-side PDF path rendered through Playwright. That sounds like an unrelated feature until the product loop is considered: a simulation is useful for exploration, while a PDF is useful for forwarding to the person who controls the budget and refuses to open a 3D map during procurement.
After the hackathon, the repository gained CI, linting, strict type boundaries, smaller modules, search metadata, and an engineering guide. The audited commit passes tsc --noEmit --incremental false; ESLint reports zero errors and two existing warnings, one missing React hook dependency in app/sightline/page.tsx and one unused helper in a data script.
I would not describe that as finished software. I would describe it as a prototype that survived contact with the week after the prototype, which is rarer than the demo video suggests.
What I would keep, change, and measure next
I would keep the end-to-end product loop. Hackathon projects often optimize one impressive model call and leave the user standing beside it; Orangeboard moves from a company to a place, a board, a creative, an attention analysis, and an outbound action.
I would also keep the separation between bottom-up saliency and semantic vision. One model predicts where contrast pulls the eye, another judges what the image communicates, and the billboard region is detected independently; that structure makes failures inspectable.
I would change the score taxonomy immediately. Geometry, saliency, VLM judgment, ICP fit, and commercial availability should never share one generic word such as score; each should carry its source, time, assumptions, and calibration status.
Then I would measure the system against humans:
- Collect a fixed set of street scenes with manually verified billboard boxes.
- Compare raw OWL-ViT confidence against the saliency re-rank using intersection-over-union and failure categories.
- Run a small webcam or laboratory gaze study with consent, then compare fixation order and time-to-region against the saliency scanpath.
- Calibrate dwell assumptions separately for drivers, passengers, pedestrians, and digital viewers.
- Connect campaigns to real outcomes through QR codes, brand-search lift, geo holdouts, or matched-market experiments; do not infer conversion from a pretty heatmap.
The product can become more valuable as its claims become narrower. “We can prove everybody will see this” is flimsy; “here is the permitted placement, its approach geometry, the assumptions behind predicted attention, the businesses nearby, and the experiment we will use after launch” is a serious buying tool.
Reproduce the audit and live capture
The artifact directory operates on a local clone of the public repository:
git clone https://github.com/jasonsuhari/orangeboard.git
node .\audit-orangeboard.mjs C:\path\to\orangeboard
node .\verify-artifact.mjs
The audit pins commit dd29e3daddaedf21d52115b35dd6e42d0b797c42; it records the git window, dataset hashes and counts, traffic constants, dwell budgets, OWL re-ranking weights, source size, API-route count, fallback evidence, and explicit claim boundary.
To reproduce the UI capture, configure Orangeboard's ignored .env.local with a restricted public Mapbox token, run the repository's guarded development command, then run:
npm run dev
node .\capture-orangeboard.mjs http://127.0.0.1:3000
node .\verify-artifact.mjs
The capture script does not inspect or export the token. It records the page title, visible billboard-count label, viewport, user agent, sanitized network-failure paths, and the two screenshots; the verifier checks both PNG dimensions, the empty error boundary, every headline dataset count, the 19.86-hour git interval, current simulation constants, and absence of token-shaped strings.
The audit is about one repository commit. Rerun it before quoting these counts after Orangeboard changes; a technical article should age like a versioned result, not a tattoo of main.
FAQ
What is Orangeboard?
Orangeboard is the repository and project identity behind Peel, a prototype that turns billboard inventory into a targeted campaign workflow: company brief, ICP geography, permitted placement, creative, attention analysis, report, and outbound.
Did Orangeboard really win the YC AI Growth Hackathon?
The NUS Computing profile reports that Peel won first place against 59 other submissions during the 24-hour hackathon at Y Combinator's San Francisco office. The repository independently records a 19.86-hour interval from its first commit to its deployment-finalization commit; that interval supports the build timeline without proving every hackathon action.
Does Orangeboard simulate thousands of pedestrians?
The current audited checkout uses a baseline of 150 pedestrian agents and 80 car agents, scaled by hour. A session can generate many observations over time, but the repository does not render thousands of pedestrians simultaneously; the article uses the exact current constants.
Is Orangeboard's attention score real eye tracking?
No. It is a model output combining pixel saliency, dwell-limited synthetic gaze, a detected billboard region, and vision-model judgments. It can be inspected and tested, but it is not measured gaze from real people.
Are the 559 billboard placements real?
They are records from San Francisco Planning's General Advertising Sign Program with coordinates and permit metadata. The records do not by themselves establish current availability, dimensions, rate, ownership, or bookability; those details still require seller or field confirmation.
Why use saliency and a vision-language model together?
Saliency predicts where low-level visual contrast may pull the eye; the vision-language model judges semantic outcomes such as message recall and legibility. Keeping them separate avoids asking one model to fake both visual attention and understanding.
Sources and artifact map
- Orangeboard / Peel public repository and audited commit
- NUS Computing: Why an NUS Student Turned Down Internships to Build in San Francisco
- SF Planning General Advertising Sign Program
- OpenStreetMap Overpass API
- Itti, Koch, and Niebur: A Model of Saliency-Based Visual Attention for Rapid Scene Analysis
- OWL-ViT: Simple Open-Vocabulary Object Detection with Vision Transformers
- deck.gl
MapboxOverlayinterleaved rendering - Reproducible audit, audit results, live capture script, capture results, and offline verifier
- Immutable public audit mirror, v1.0.0 release, and citation metadata
- Download the exact claim-boundary SVG or source CSV; the chart keeps grounded, modeled, heuristic, and unestablished signals visibly separate.

Conclusion
Orangeboard won because it made an abstract marketing question physical. A company URL became a patch of San Francisco; that patch contained real permit records, roads, businesses, fake traffic, predicted gaze, generated creative, and finally an outbound action. The map made the idea legible before the judge had time to inspect every assumption, which is the main superpower and main danger of a good demo.
The technically interesting work begins where the pitch ends. There are 559 grounded billboard records and 52,377 grounded road segments; there are also 150 invented pedestrians, 80 invented cars, four invented gaze viewers, modeled attention, heuristic placement scores, and zero measured conversions. Those layers can coexist as long as the interface and article never confuse them.
I built a tiny San Francisco so fake commuters could roast a billboard; the next version should make their criticism more useful, their assumptions more visible, and absolutely no claim that any of them are available for a customer interview.